

Florida Car Accident Statistics by County






Most Florida crash figures in circulation are missing at least one of three things: the year the data covers, a plain statement of what is being counted, and the name of the agency that actually published it. Leave any one of them out and the number stops being a fact and becomes a rumor with a decimal point.
This page is the reference. Every figure on it carries its data year, its status as finalized or preliminary, and its source, stated in the copy rather than buried in a footnote. Where a figure does not exist, the page says so and explains why, because the most common problem in published crash data is not a wrong number. It is a number nobody ever published.
Why Choose Elstein Legal
Brian Elstein defended these claims for insurance companies before he began bringing them. He has read the files from the other side, which is where you learn how quickly a loose statistic in a demand letter gets turned around on the person who wrote it. Elstein Legal is a solo practice in South Miami, so the lawyer who reads your file is the lawyer who handles it. No fees unless we win.
Three Questions Every Crash Figure Has to Answer
Ask these three questions of any crash statistic, including the ones on this page, and most of what circulates online falls apart.
Does it count crashes, or people? These are different numbers and they are not close. Multi-fatality crashes exist, so Florida runs roughly 1.07 deaths for every fatal crash. In 2024 the state recorded 2,891 fatal crashes and 3,098 people killed, a gap of 207 people. A page that publishes the fatal-crash count and calls it a death toll has understated the year by more than two hundred lives.
What data year is it, and is the year final? Florida crash years 2017 through 2024 are finalized and will not move. Years 2025 and 2026 are preliminary: they come from a live dashboard, they are still being amended as late reports arrive, and they will not match a future annual report. A figure with no year attached is unusable, and a preliminary figure presented as settled is worse than no figure at all.
Which agency actually publishes it? Florida crash counts come from the Florida Department of Highway Safety and Motor Vehicles. State-against-state comparisons come from NHTSA’s Fatality Analysis Reporting System or from the Insurance Institute for Highway Safety. Uninsured-driver rates come from the Insurance Research Council. Attributing a figure to the wrong body is the quiet version of making it up.
South Florida Crash Data by County, 2024
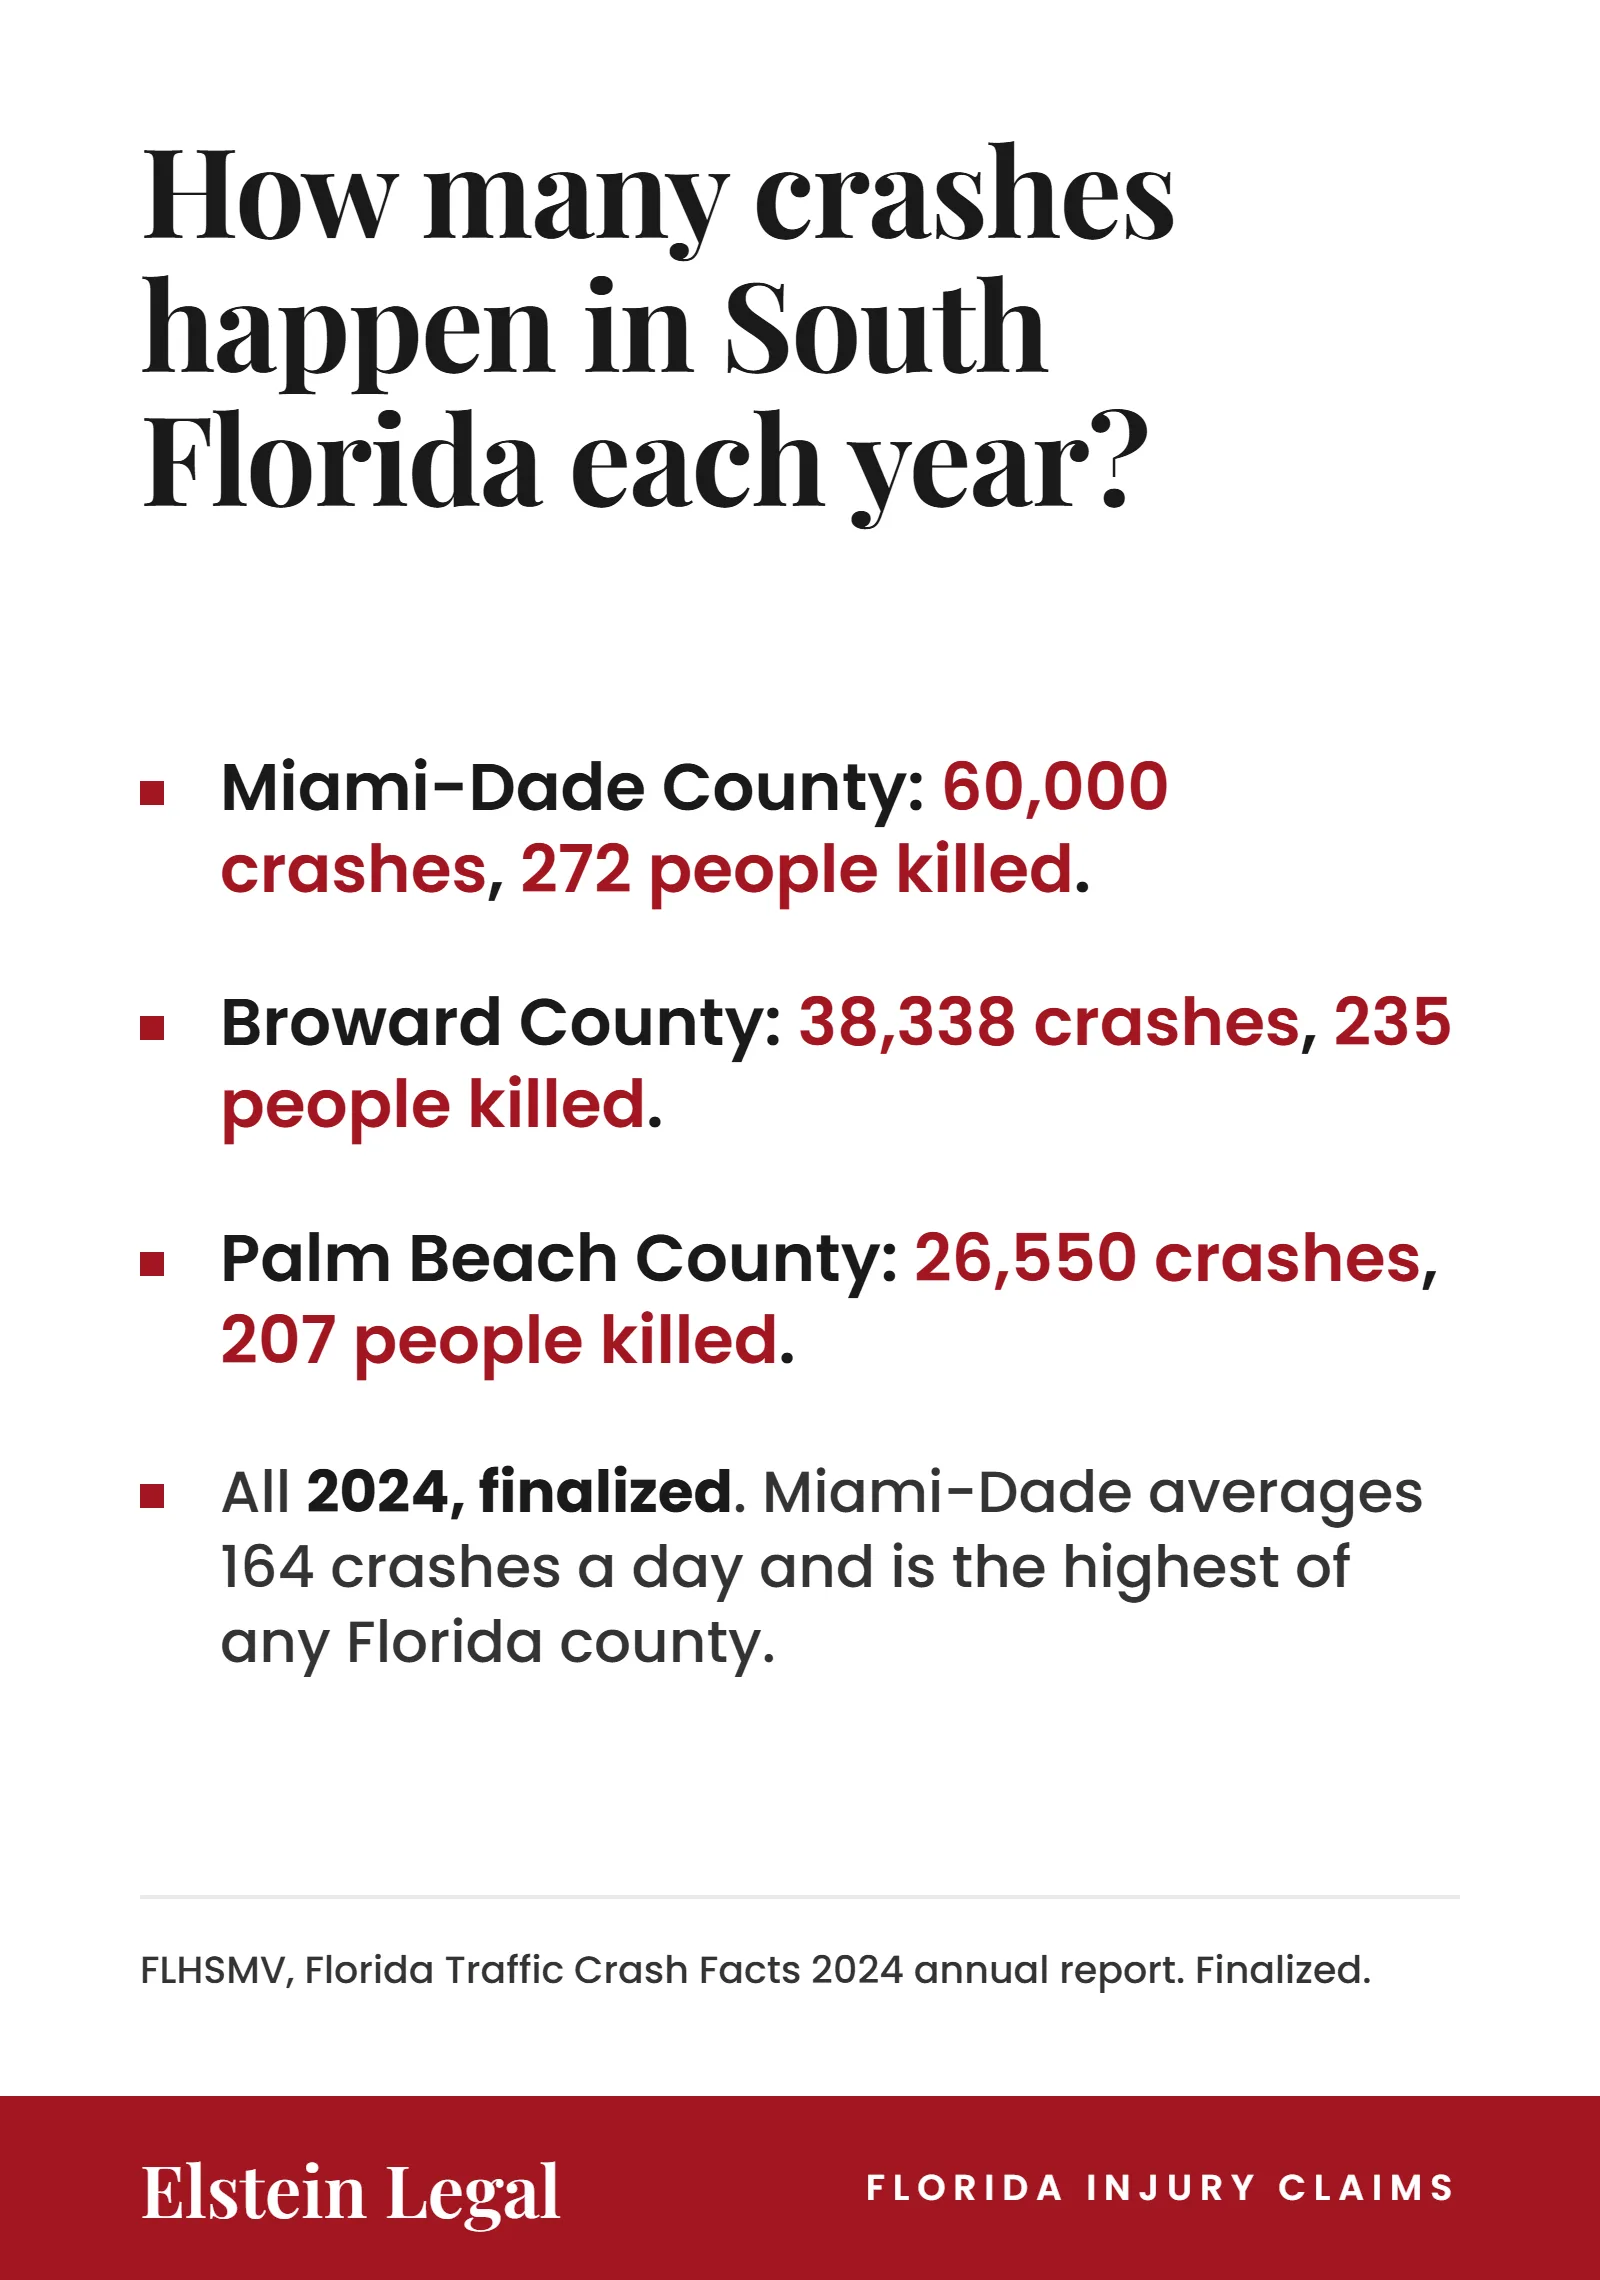
Everything below is the 2024 finalized year, published by the Florida Department of Highway Safety and Motor Vehicles. These are county figures and they are labeled as county figures throughout.
| Metric, 2024 finalized | Miami-Dade | Broward | Palm Beach |
|---|---|---|---|
| Total crashes | 60,000 | 38,338 | 26,550 |
| People killed | 272 | 235 | 207 |
| Fatal crashes | 259 | 221 | 184 |
| People injured | 29,359 | 23,115 | 16,564 |
| Hit-and-run crashes | 19,046 | 11,577 | 6,950 |
| Hit-and-run share of all crashes | 31.7% | 30.2% | 26.2% |
| Pedestrian crashes | 1,876 | 1,219 | 807 |
| Pedestrian deaths | 75 | 69 | 61 |
| Bicycle crashes | 1,001 | 1,008 | 724 |
| Bicycle deaths | 20 | 22 | 6 |
| Motorcycle crashes | 1,398 | 777 | 489 |
| Motorcycle deaths | 67 | 36 | 32 |
Source: FLHSMV, 2024, finalized.
Read the first three rows together, because they are the clearest illustration of the crashes-against-people problem on this page. Miami-Dade’s 272 is people killed. Its 259 is fatal crashes. Thirteen more people died than there were crashes in which somebody died, and any sentence that treats those two numbers as interchangeable is wrong no matter which one it quotes.
One more caveat belongs with this table and it comes from page 1 of the report itself. The statistics are subject to change as new and updated crash reports arrive after the closeout date of January 22, 2026, and sub-tables in the report may not add to the summary totals because some crash report fields accept more than one selection. Where a summary table exists, that is the one to cite.
Florida Statewide, 2024
| Metric, 2024 finalized | Value |
|---|---|
| Total codable crashes | 381,423 |
| Average crashes per day | 1,799 |
| Fatal crashes | 2,891 |
| People killed | 3,098 (FLHSMV) or 3,138 (NHTSA FARS) |
| Incapacitating injuries | 14,026 |
| Pedestrian deaths | 706, down from 779 in 2023 |
| Pedestrian crashes | 12,223, up from 10,276 in 2023 |
Source: FLHSMV, 2024, finalized, except the FARS figure as marked.
Two Florida death totals for the same year look like an error and are not one. FARS counts a death only where the crash happened on a public trafficway and the person died within 30 days. State files also capture deaths that come later, crashes on private property, and non-transport incidents, and state counts keep moving as reports are amended while FARS freezes each year on publication. The two are built on different rules, so a gap is expected in either direction. Pick one and label which one you picked.
Notice the pedestrian rows as well. Crashes rose and deaths fell between 2023 and 2024, so any framing built on a sharp rise in pedestrian deaths that year is not supported by the state’s own data.
You will not find a statewide injury total here. The figure is not in this reference, and inventing one to fill the row would defeat the point of the page.
Figures You Can Safely Work Out From the Table
Arithmetic on a published figure carries the same authority as the figure, provided the arithmetic is honest about what it divided.
- 164 crashes a day in Miami-Dade County. That is 60,000 divided by 365, using the 2024 finalized total. It is not 148, which is a figure that circulated for a while and was never right.
- About 16 percent of the Florida total. Miami-Dade’s 60,000 is 15.7 percent of the statewide 381,423, both 2024 finalized.
- The highest total of any Florida county. Broward is next at 38,338, so Miami-Dade runs about 1.57 times the second-placed county. Ranked by total crashes in 2024: Miami-Dade 60,000, Broward 38,338, Palm Beach 26,550, Hillsborough 26,269, Orange 25,415, Duval 23,013, Lee 14,737, Pinellas 14,391.
One piece of arithmetic that looks safe is not. The 14,026 incapacitating injuries in the statewide table counts people, and the 381,423 counts crashes, so dividing one into the other compares two different things and produces a percentage of nothing. Incapacitating injury is also the state’s own severity classification rather than a legal category, and it does not mean the same thing as a catastrophic injury in a claim. The comparison that does work is people against people: 14,026 incapacitating injuries against 3,098 deaths in 2024, so roughly four and a half people survive the most severe injury classification for every one who does not.
Miami-Dade Over Ten Years, and What Not to Do With It
| Year | Status | Crashes | Deaths | Injuries | Hit-and-run |
|---|---|---|---|---|---|
| 2024 | Finalized | 60,000 | 272 | 29,359 | 19,046 |
| 2023 | Finalized | 64,009 | 325 | 29,816 | 21,394 |
| 2022 | Finalized | 63,540 | 309 | 28,726 | 21,803 |
| 2021 | Finalized | 62,536 | 352 | 28,706 | 21,410 |
| 2020 | Finalized | 51,543 | 314 | 24,228 | 17,187 |
| 2019 | Finalized | 65,143 | 298 | 31,698 | 20,903 |
| 2025 | Preliminary | 56,062 | 275 | 26,672 | 17,603 |
Source: FLHSMV. Status shown per row. Deaths counts people killed, not fatal crashes.
Two rows in that table need handling rather than quoting.
The 2020 row is the pandemic. Traffic volume collapsed and the crash count went with it, so any five-year window that straddles 2020 will produce a trend that is about lockdowns rather than about roads. Compare 2019 to itself or compare finalized years either side of the gap, but do not average across it.
Preliminary, on the 2025 row, means something specific rather than something vague. That row is a live dashboard extract, while the 2024 row is a closed-out statutory report. Putting them side by side and calling the difference a decline compares two documents that were built to different rules and closed on different dates. The honest comparison here is 2023 against 2024, both finalized: crashes down 6.26 percent and deaths down 16.31 percent.
Hit-and-Run Is Roughly One Crash in Three
| Hit-and-run share of all crashes | Miami-Dade | Broward | Palm Beach | Florida |
|---|---|---|---|---|
| 2024 | 31.7% | 30.2% | 26.2% | 25.7% |
| 2023 | 33.4% | 30.9% | 26.5% | 26.6% |
| 2022 | 34.3% | 30.7% | 27.2% | 27.1% |
Source: FLHSMV, all years finalized.
Miami-Dade County runs about 1.24 times the statewide rate and has held above 31 percent every year since 2022. It accounts for 15.7 percent of Florida’s crashes and 19.4 percent of its hit-and-runs, all 2024 finalized.
This page publishes that figure and stops there. What a hit-and-run does to a claim, and which layer of coverage is left to pay when the driver is never identified, is a separate subject and the firm covers it at proper length in what a hit-and-run means for your own claim.
Four Things This Page Will Not Do
The refusals are the reason to trust the rest of it.
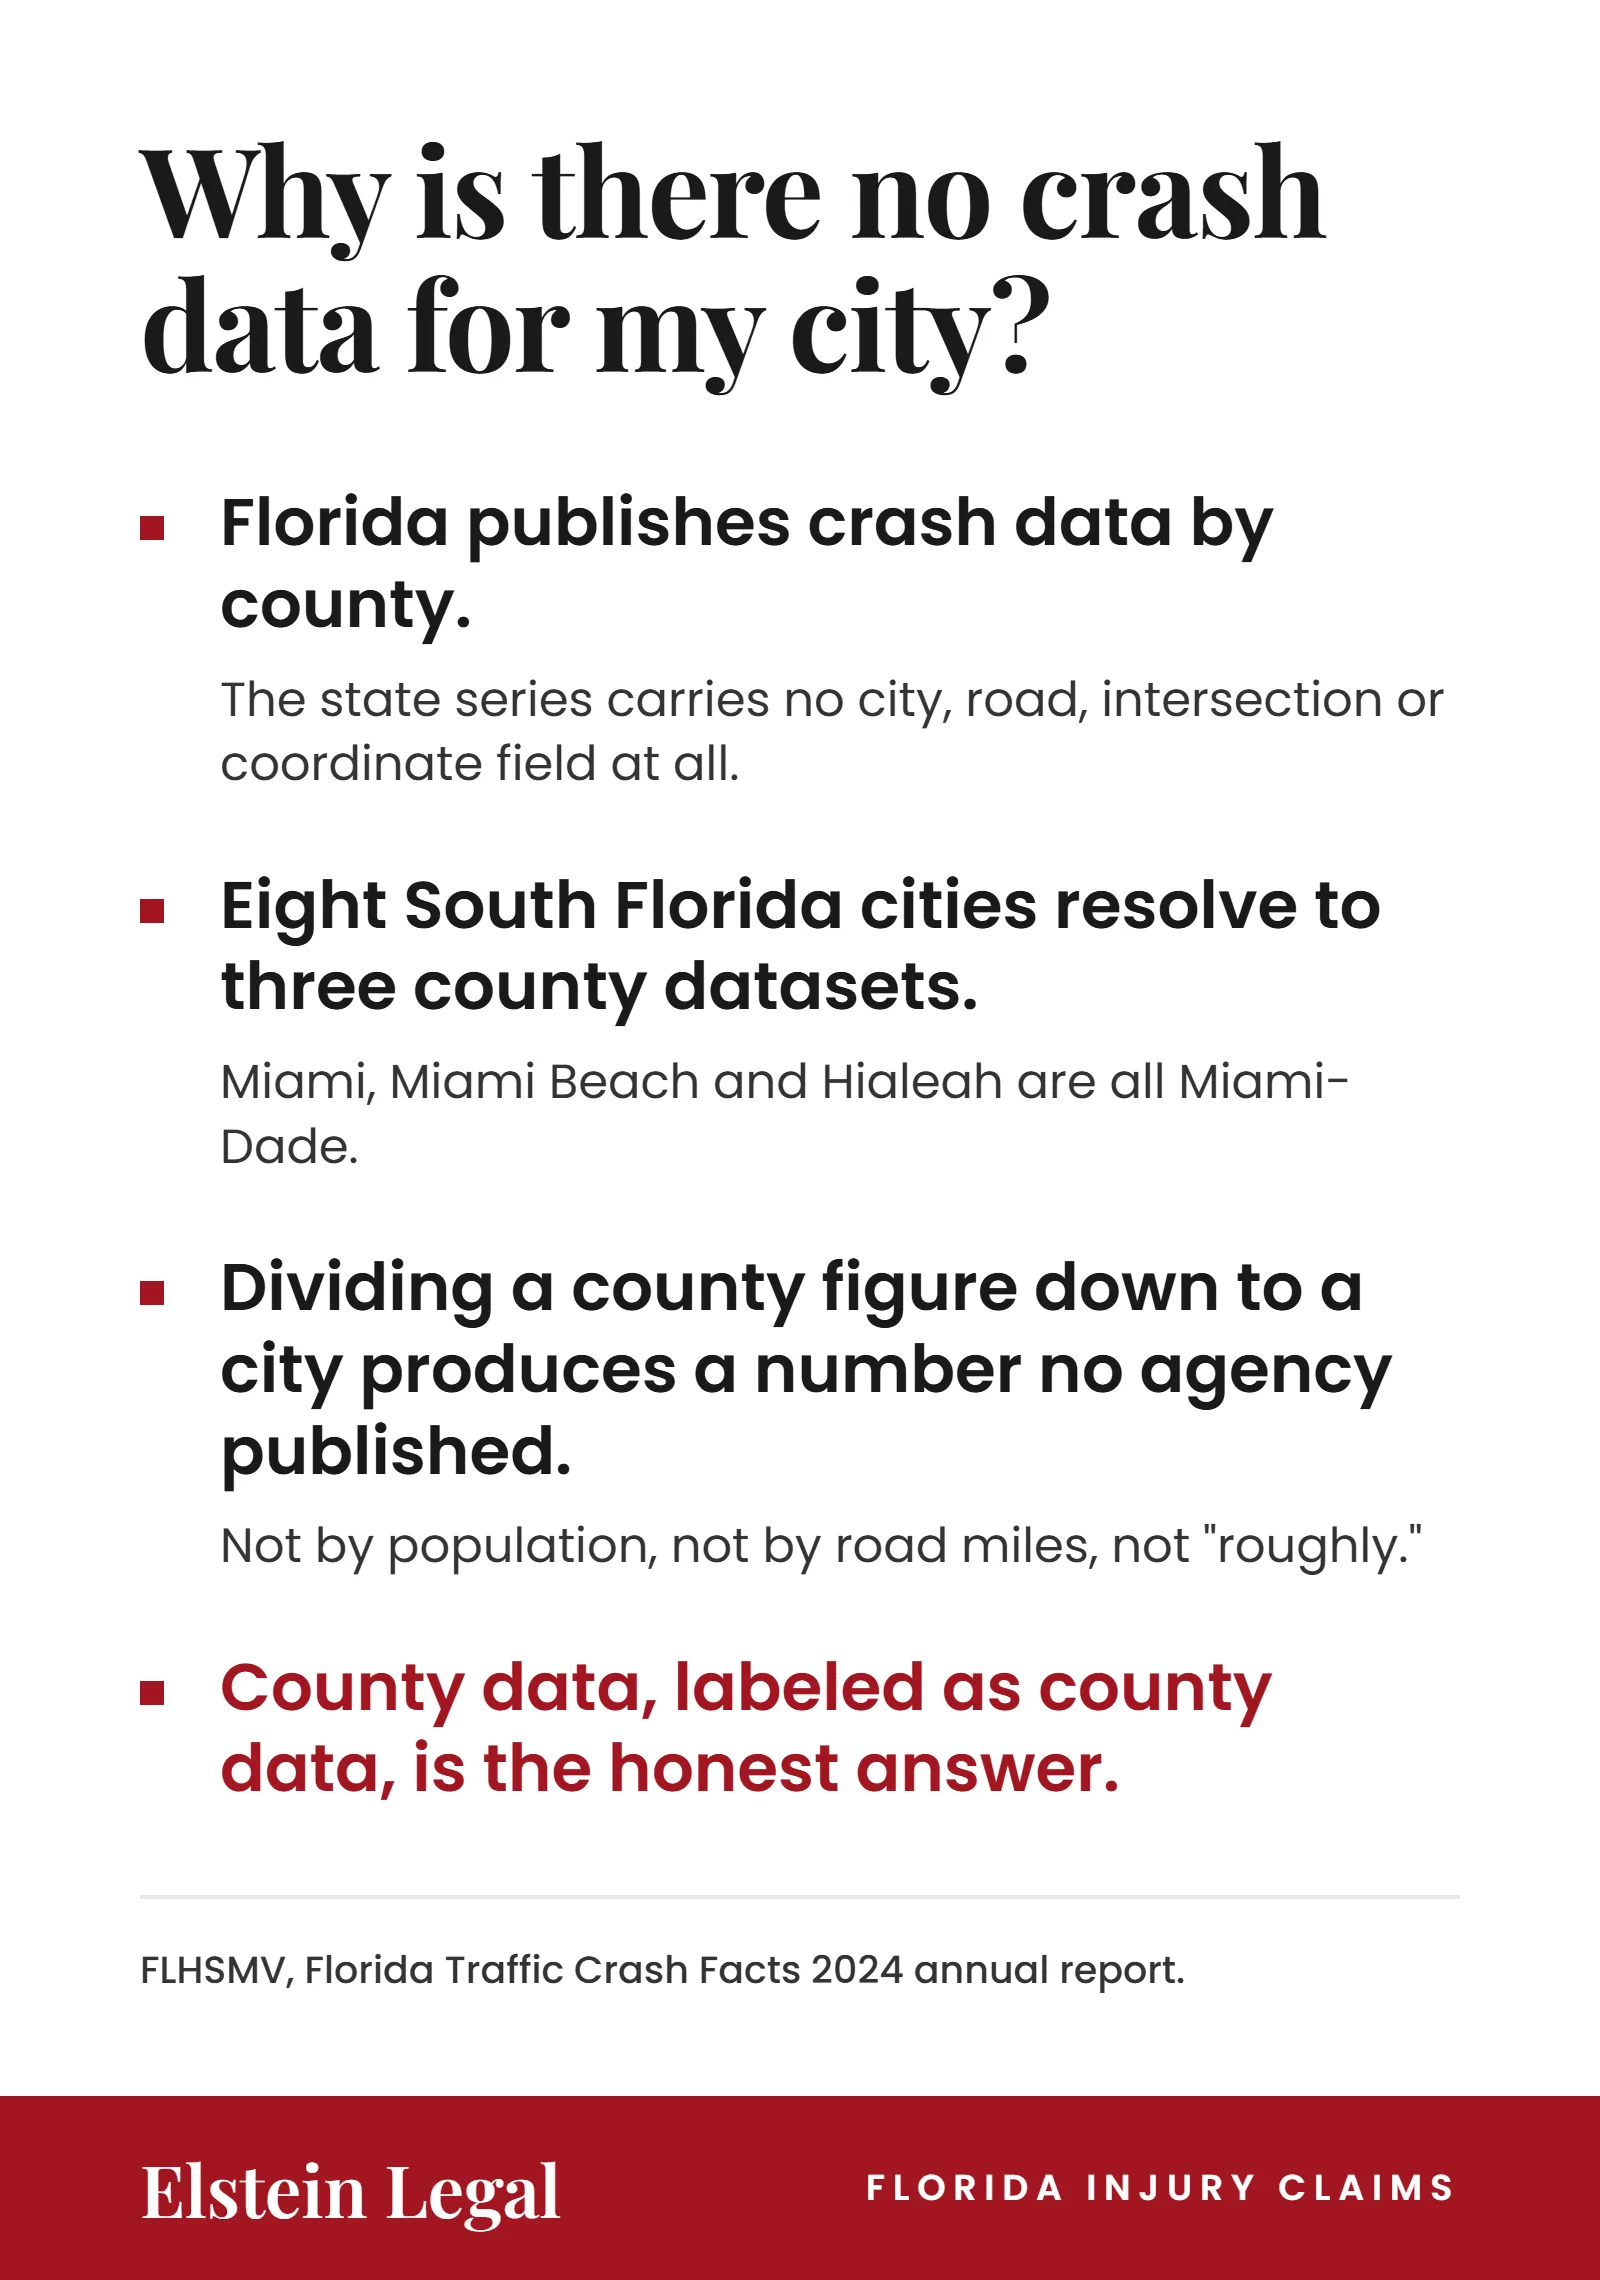
No city-level figure, ever. The state crash series has exactly two geographic fields: county code and county name. There is no city, no road, no intersection and no coordinate anywhere in it. So a Miami figure, a Hialeah figure or a Boca Raton figure cannot be produced from this data by any method. Dividing a county figure by population, by registered vehicles, by road miles or by anything else produces a number no agency published, and attributing that number to the state is fabrication rather than estimation.
No national ranking attributed to FLHSMV. Florida Traffic Crash Facts is a Florida-only statutory report and it contains no state-against-state ranking of any kind. A claim that Florida ranks first or fifth or anything else nationally comes from NHTSA FARS or the IIHS state-by-state tables, and uninsured-driver rates come from the Insurance Research Council. Any page that attaches a national ranking to the state agency has cited the wrong body.
No annualized part year. A year in progress is not multiplied up to a full-year estimate here, and a part year is never compared against a complete one.
No figure without its metric definition. Crashes are not people, fatal crashes are not deaths, and injuries are not crashes. Every number on this page says which it is.
One honest qualification on the first refusal. Sub-county crash datasets do exist for Miami-Dade and for Palm Beach, published as open geographic data by bodies other than the state, and none exists for Broward at all. They count different things over different periods under different definitions, so they are not comparable to the county series on this page and nothing from them appears here. When one of them is verified properly, it will be published as its own thing with its own agency, year and definition attached, and never blended into a state figure.
Which County Each City Belongs To
This is the part readers get wrong most often. Eight South Florida cities resolve to three county datasets, and the figure that covers a city is the figure for the county it sits in.
| County | Cities it covers |
|---|---|
| Miami-Dade | Miami, Miami Beach, Hialeah |
| Broward | Fort Lauderdale, Pompano Beach |
| Palm Beach | West Palm Beach, Delray Beach, Boca Raton |
Printing that map is not permission to divide a county figure by three. It is the opposite: it tells you which single row applies to all of them.
The firm works claims across all eight, and each page below belongs to the county shown against it. Miami sits in Miami-Dade County, so the Miami-Dade row above is the one that covers injury claims across Miami. Miami Beach is Miami-Dade County too, which is why the same 60,000 stands behind the firm’s Miami Beach page. Hialeah is the third Miami-Dade city, and the county figure is the only published figure behind how the firm handles Hialeah cases. Fort Lauderdale falls in Broward County, so the 38,338 row is what applies to Fort Lauderdale injury representation. Pompano Beach is the second Broward city, and the same county row covers claims arising in Pompano Beach. West Palm Beach sits in Palm Beach County, where the 2024 total was 26,550, which is the figure behind West Palm Beach injury work. Delray Beach is Palm Beach County as well, so that same row is what stands behind what the firm does in Delray Beach. Boca Raton completes the Palm Beach group, and the county figure is the published number relevant to injury matters in Boca Raton.
What This Page Is For
It is a reference, and anyone is welcome to use it as one. Cite the figure with its county, its year and its status, name the agency, and the number will hold up when somebody checks it. That is a lower bar than it sounds and a striking number of published pages do not clear it.
Two things sit just outside this page and are worth knowing. The deadline to file most Florida injury lawsuits is two years from the date of the crash under § 95.11(5)(a), not the four years many older pages still show. And the question a crash figure never answers is who actually pays, which depends on the layers of coverage sitting behind the at-fault driver rather than on any county total; the firm sets those out in which policies actually pay after a crash.
The primary sources behind this page are the FLHSMV Florida Traffic Crash Facts 2024 annual report and the FLHSMV crash dashboard. More of this library is at the rest of the resource library. If you were hurt in one of the crashes behind these numbers and want a straight answer about your own case, tell us what happened.
Frequently Asked Questions
How many car accidents happen in Miami-Dade County each year?
Miami-Dade County recorded 60,000 crashes in 2024, which is the most recent finalized year published by FLHSMV. That works out to about 164 a day. The 2025 figure of 56,062 is preliminary and will move as late reports are processed.
What is the most recent finalized Florida crash data?
2024. FLHSMV years 2017 through 2024 are finalized and will not change. 2025 and 2026 are preliminary, come from the live crash dashboard rather than the annual report, and must be labeled preliminary wherever they are used.
Is there crash data for the city of Miami by itself?
Not in the state series. The FLHSMV data has county code and county name as its only geographic fields, so the smallest unit that exists is the county. Miami, Miami Beach and Hialeah all resolve to Miami-Dade County, and a city figure produced by dividing the county figure is not a published statistic.
How many people died in Florida crashes in 2024?
3,098 people were killed in 2024 according to FLHSMV, in 2,891 fatal crashes. NHTSA FARS puts the death total for the same year at 3,138 because it counts on different rules. Both are 2024 figures and both are final for their source.
Why do FLHSMV and NHTSA report different Florida death totals?
FARS counts a death only if the crash was on a public trafficway and the person died within 30 days of it, and it freezes its file annually. The state file also captures later deaths, private property crashes and non-transport incidents, and it keeps adjusting as crash reports are amended. The gap is a difference in counting rules, not an error in either source.
Which Florida county has the most crashes?
Miami-Dade, by a wide margin. Its 60,000 crashes in 2024 are about 1.57 times Broward’s 38,338 and account for 15.7 percent of the statewide total of 381,423. All three figures are 2024 finalized.
Can I use these figures in my own report or article?
Yes, and the only request is that you carry the label with the number. Name the county, the year, the status as finalized or preliminary, and FLHSMV as the publisher, and state whether the figure counts crashes or people. A figure repeated without those labels is the reason this page exists.
Reach Brian Elstein, Miami Personal Injury Lawyer
The consultation is free and there is no fee unless we win. Tell Brian what happened and find out what your case is really worth.
Find out what your case is worth
Free, confidential evaluation. We’ll contact you right away.